Table of Contents
Description: BlockAtlas
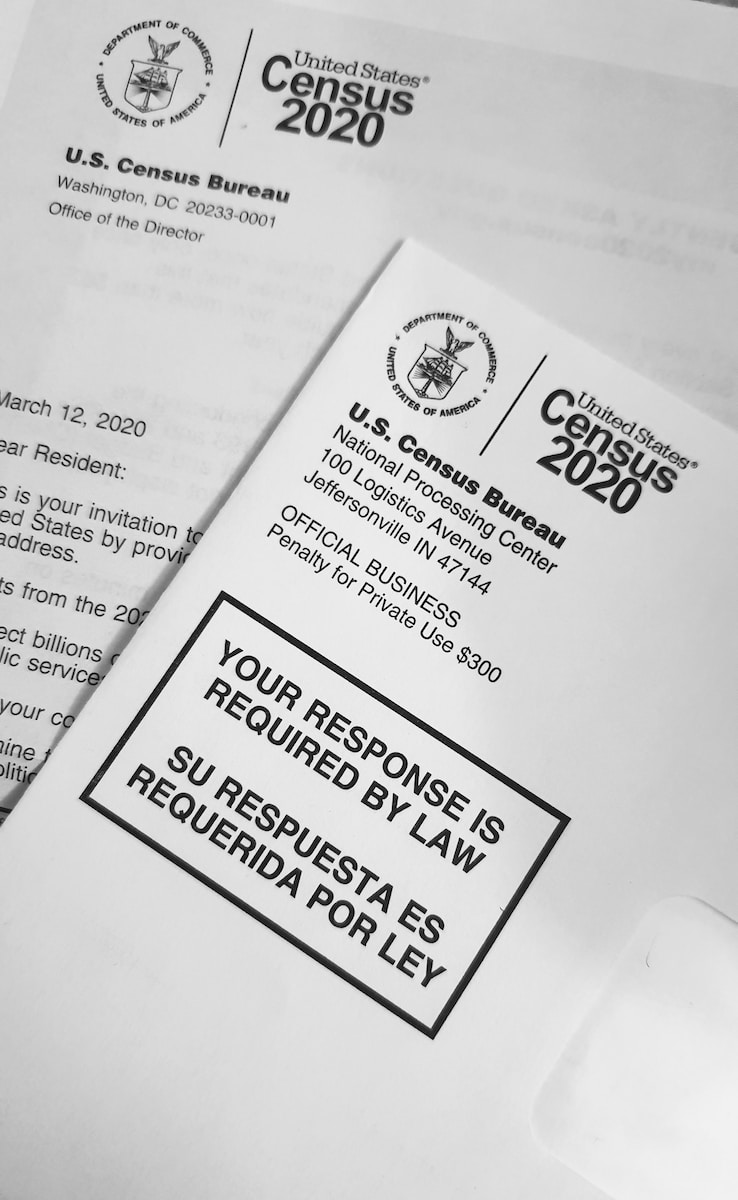
BlockAtlas is a plugin designed to access and analyze US Census data. It provides users with the ability to retrieve specific datasets related to demographic and economic trends across various regions and time periods in the USA.
>> Complete List Of ChatGPT Plugins <<
The blockatlas plugin provides functionalities related to the US Census data. Here are its capabilities:
- nearestVars: This function allows you to find a specific data set based on a query. For example, if you’re interested in “median income by county in Nebraska”, you can use this function to locate the relevant data set.
- getMapAndData: This function retrieves data for a specific variable or a combination of variables for one or more locations within a region. Here are its parameters:
- map_title: The title for the map, such as ‘Median Income’.
- variable: The specific variable(s) for which data is to be retrieved. It can be a single key or a comma-separated list of variables.
- normalize_by: This is used when you want to find a percent, a proportion, or a per-capita value. For instance, to find the ‘over 85 rate’, you’d divide ‘People over 85’ by ‘People with age determined’.
- aggregation_mode: This is required if more than one variable is requested. It can be ‘combine’ (to add variables together) or ‘compare’ (to show variables side by side).
- geography_type: Specifies the type of geography for which data is to be retrieved. Options include “STATE”, “COUNTY”, “CITY”, “ZIP_CODE”, “COUNTIES_WITHIN_STATE”, “STATES_WITHIN_USA”, “COUNTIES_WITHIN_USA”, and “USA”.
- place: The specific place for which data is to be retrieved, such as ‘Arlington, VA’, ‘VA’, or ‘United States’.
- limit: Specifies how many results to return.
- sort: Determines the sorting order, either ‘asc’ or ‘desc’.
- years: Specifies the years for which data is required. For example, “2019-2021” would show the change from 2019 to 2021, while “2019,2020,2021” would show data for each year side by side.
Available Function(s) and Parameters:
- nearestVars:
query: A query that should be semantically similar to the target variable.
- getMapAndData:
map_title: Title for the map.variable: The specific variable(s) for data retrieval.normalize_by: Variable to divide by for percentages or per-capita values.aggregation_mode: Mode for handling multiple variables (‘combine’ or ‘compare’).geography_type: Type of geography (e.g., “STATE”, “COUNTY”).place: Specific place for data retrieval.limit: Number of results to return.sort: Sorting order (‘asc’ or ‘desc’).years: Specific years for data retrieval.

Basic Prompt:
“Can you show me the median income data for New York state from 2019 to 2021?”
Use Case Interpretation:
BlockAtlas can be immensely beneficial for researchers, policymakers, students, and anyone interested in understanding demographic and economic shifts in the USA. By accessing detailed Census data, users can make informed decisions, track regional growth, and identify patterns that might impact future strategies or studies.
Advanced Prompts:
- “Provide a comparison of the population growth rate between California and Texas from 2010 to 2021.”
- “Show me the percentage of people over the age of 85 in all counties within Florida for the year 2021.”
- “I’d like to see a combined data set of median income and education level for the entire USA for the years 2015, 2018, and 2021.”
Unusual Prompts:
- “Which state has the highest number of people who claim to be Jedi Knights? (Assuming such a dataset exists in the Census)”
- “Can you find out if there’s a correlation between the number of pet owners and the number of single households in a specific city?”
- “I’m curious about the ice cream consumption rate in Alaska during winter. Can you pull that up?”

Multi-Step Prompts:
BlockAtlas is capable of multi-step prompts. Here are examples using BlockAtlas in conjunction with other plugins:
- BlockAtlas + WebPilot:
- User: “Find the latest article on population growth in the USA.”
- WebPilot fetches the article.
- User: “Now, compare the data from the article with the Census data from 2020.”
- BlockAtlas provides the comparison.
- BlockAtlas + Noteable:
- User: “I want to visualize the median income growth in Texas over the past decade.”
- BlockAtlas fetches the data.
- Noteable creates a visual representation (e.g., a graph) of the data.
- BlockAtlas + There’s An AI For That:
- User: “I’m looking for AI tools related to demographic studies.”
- There’s An AI For That suggests tools.
- User: “Great! Now, can you show me the age distribution in California for 2021?”
- BlockAtlas provides the data.
By integrating BlockAtlas with other plugins, users can achieve comprehensive solutions, combining the power of Census data with various other functionalities to gain deeper insights and make well-informed decisions.


